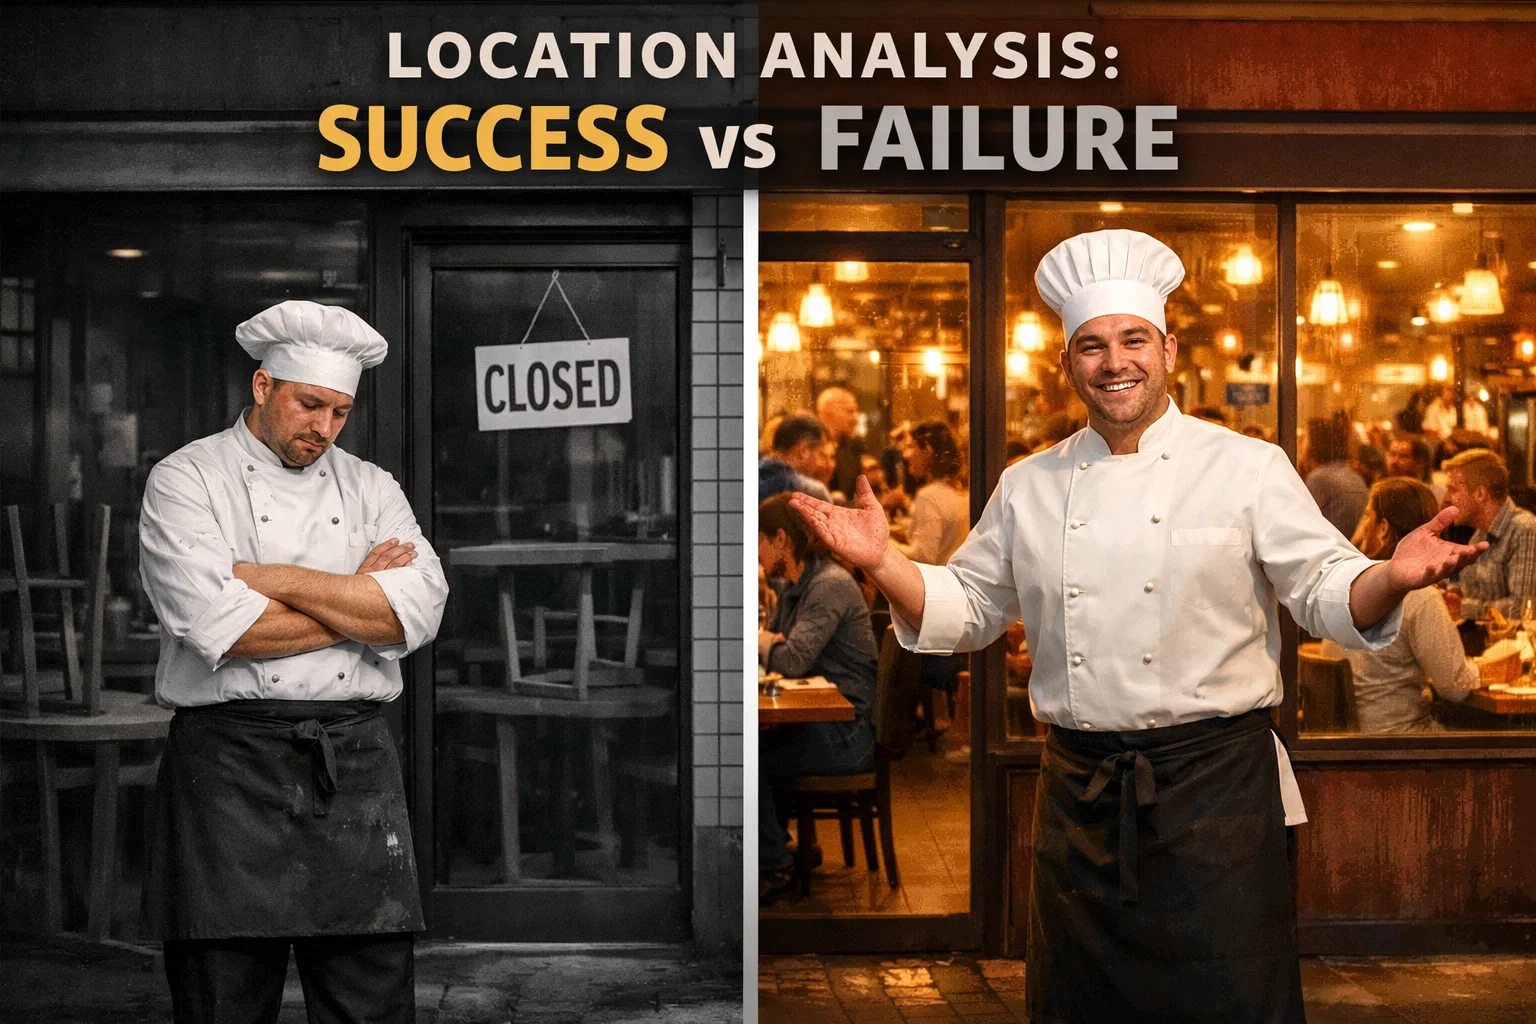
Marco spent 15 years perfecting his Italian recipes, working in Michelin-starred restaurants, and saving every dollar to open his dream trattoria. When he finally found a space in downtown Seattle with “incredible foot traffic” on a busy street, he signed the lease within a week.
Eighteen months later, Marco closed the doors permanently, having lost $178,000.
The problem wasn’t his food—Yelp reviews averaged 4.5 stars. The problem wasn’t his service or pricing. The problem was location. The “busy street” was filled with commuters driving 40 mph with nowhere to park. The nearby offices emptied by 6 PM, right when dinner service began. The residential population within walking distance couldn’t afford $28 entrees.
According to the National Restaurant Association, 60% of new restaurants fail within the first three years, and location choice is the single most significant factor. The tragedy is that these failures are completely preventable with proper restaurant location analysis.
Why Restaurant Location Analysis Is Different
Restaurant location analysis requires a fundamentally different approach than retail stores or service businesses. The unique economics of food businesses create specific location requirements that can’t be ignored.
Higher Investment Creates Higher Risk
The average restaurant buildout costs $150-400 per square foot compared to $50-150 for most retail. A modest 2,000 square foot restaurant requires $300,000-800,000 in buildout costs alone—money that’s completely unrecoverable if the location fails. You can’t take the commercial kitchen, custom bar, or dining room buildout with you.
Can’t Pivot After Opening
Unlike online businesses or mobile services, restaurants are permanently anchored to their location. Once you’ve installed a commercial kitchen, you can’t test a different neighborhood. Most restaurant leases are 5-10 years with personal guarantees. Getting the location right the first time is absolutely critical.
Location Affects Everything
Your location determines customer base, pricing power, labor costs, supplier relationships, delivery economics, and competitive positioning. Research from Cornell University found that location factors account for 60-70% of restaurant success variance. More sobering: restaurants in poor locations fail at rates exceeding 80% within three years, regardless of food quality.
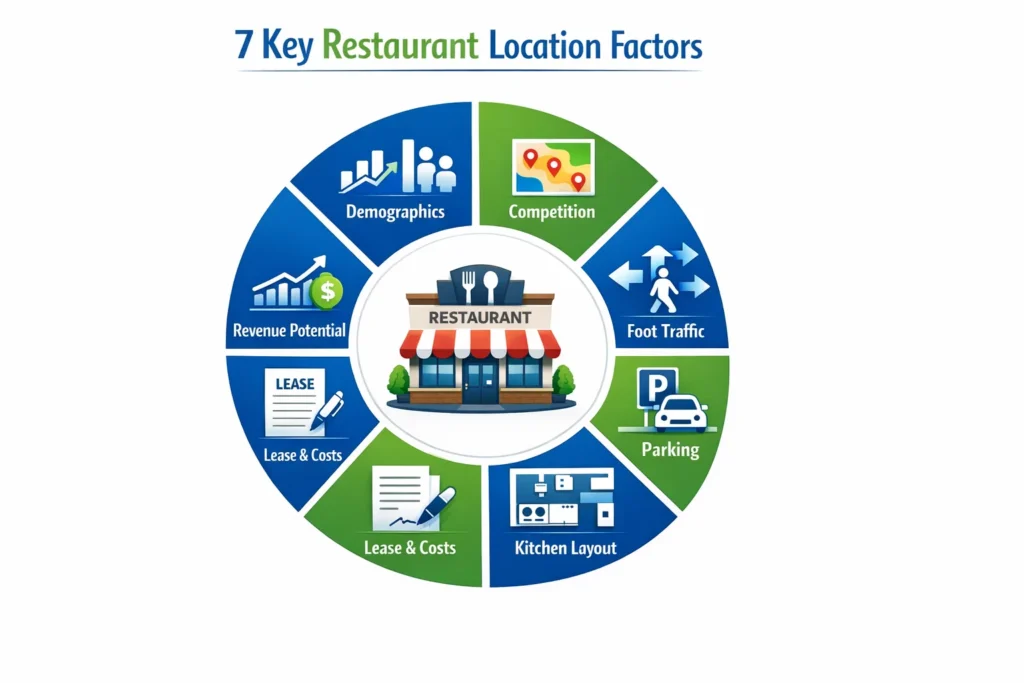
The 7 Critical Factors in Restaurant Location Analysis
1. Demographics: Who Lives and Works Nearby
Income levels must match your price point. A fine dining restaurant charging $40+ per entree needs median household incomes above $80,000 within your trade area. Quick-service can succeed with $40,000-60,000. Age distribution shapes concept viability—trendy cocktail bars need 25-40 year olds, family restaurants need households with children.
Real example: A sushi restaurant in Austin analyzed two locations. Location A had median income of $95,000 but 45% families with young children. Location B had $78,000 income but 65% were 25-45 year old professionals. Despite lower income, Location B was perfect for the $18-28 per entree concept. The restaurant chose Location B and exceeded projections by 23% in year one.
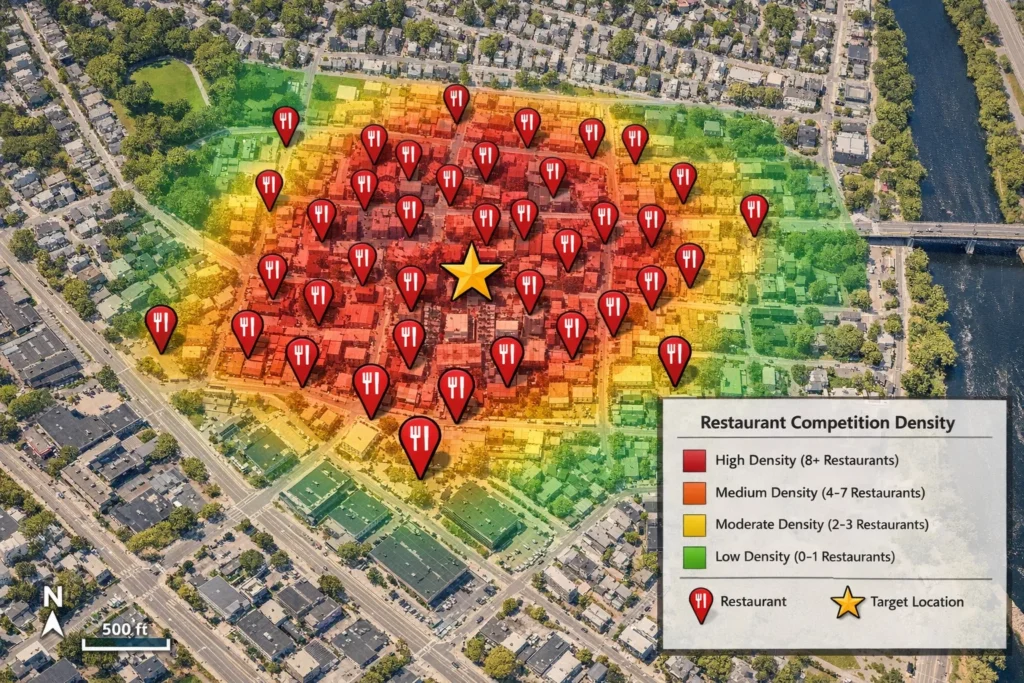
2. Competition Density Analysis
The general rule is one restaurant per 300-500 residents depending on demographics. Calculate your market: if there are 15,000 residents within one mile, the market can support 30-50 restaurants. If 60+ already exist, saturation is high.
Complementary competition can be beneficial. A cluster of diverse restaurants creates a dining destination. Being the only restaurant in a mile radius often signals the location doesn’t support restaurants well. Analyze not just quantity but pricing tiers and competitor performance through ratings and visible traffic.
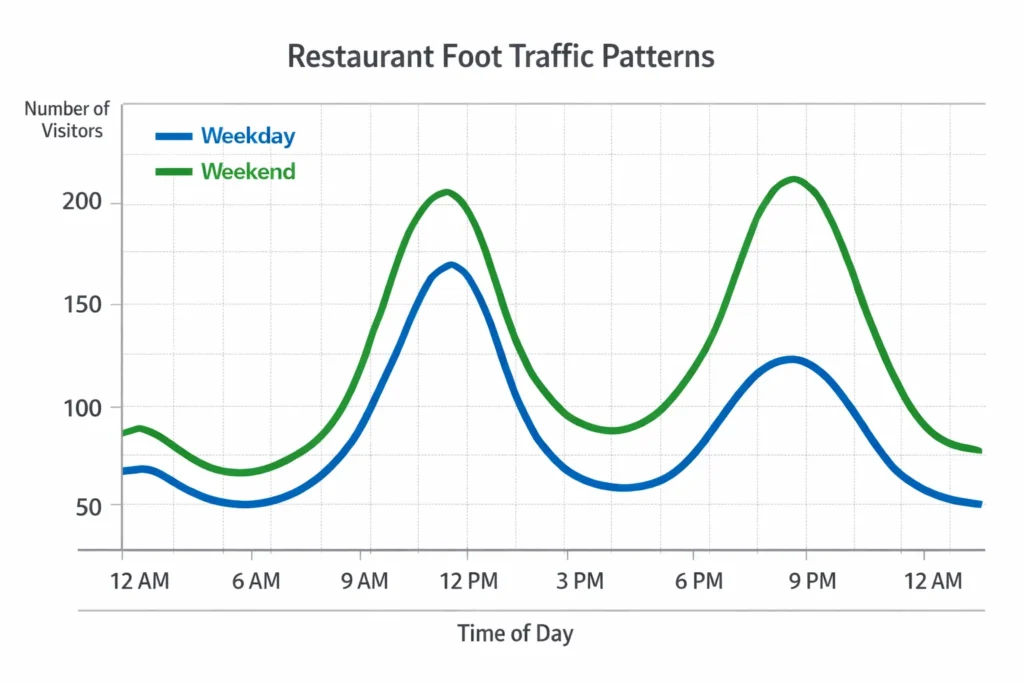
3. Foot Traffic Patterns That Matter
Not all foot traffic is equal. Meal period alignment is critical—a breakfast cafe needs strong 7-10 AM traffic. Evening traffic is irrelevant. Conversely, dinner restaurants need 5-10 PM traffic.
Commuter traffic rarely converts. Heavy vehicle traffic looks impressive but commuters driving 45 mph don’t stop for dinner. Foot traffic from people already in the area converts at 20-50x higher rates. Understand weekday vs. weekend patterns and seasonal variations to model revenue accurately.
4. Accessibility and Parking Requirements
Quick-service restaurants need one parking space per 100-150 square feet. Casual dining needs one per 150-200 square feet. A 3,000 square foot casual restaurant needs 15-20 parking spaces. Customers won’t walk more than 200-300 feet from parking in suburban settings.
Urban restaurants can succeed with limited parking if located within 5-minute walk of transit. Ground-floor visibility on well-traveled roads accelerates customer acquisition, while hidden locations rely entirely on expensive digital marketing.
5. Kitchen and Space Requirements
Quick-service needs 35-40% of space for kitchen. Casual dining requires 40-45%. Fine dining needs 45-50%. Any restaurant cooking with grease needs commercial ventilation hoods and grease traps costing $40,000-150,000 to install. Spaces with previous restaurant use save massive buildout costs.
Commercial kitchens need 200-400 amp electrical service. Older buildings often max out at 100-200 amps, requiring $25,000-75,000 in utility upgrades. Always verify existing systems before committing.
6. Lease Terms and Hidden Costs
CAM fees (Common Area Maintenance) add 15-35% to rent, ranging from $2-8 per square foot annually. A 2,000 square foot space at $25/sq ft base rent might carry $6/sq ft CAM fees, adding $1,000/month.
Percentage rent clauses give landlords 5-8% of gross revenue above thresholds. Budget for hidden costs: property insurance ($200-500/month), liquor liability ($300-1,000/month), trash removal ($150-400/month), pest control ($75-150/month). These easily add $1,000-2,500 monthly.
7. Revenue Potential Modeling
Revenue equals: (Covers per day) × (Average check) × (Days open per year). Start with foot traffic, apply 2-8% conversion rates, factor in repeat customers.
Example: 500 daily pedestrians, 4% convert = 20 first-timers, 30% become regulars visiting 2x/month = 15 additional covers. Total: 35 lunch + 45 dinner = 80 daily covers. At $18 lunch and $32 dinner average: $2,070 daily × 312 days = $645,840 annually.
Calculate break-even: if monthly fixed costs are $42,000 and variable cost per cover is $14 with $28 average check, contribution margin is $14. You need 3,000 monthly covers or 100 daily. If location projects only 80 daily maximum, the business model doesn’t work.
Restaurant-Specific Location Red Flags
❌ Previous restaurant failures in the space: If 2+ restaurants failed here in 3-5 years, the problem is the location.
❌ Difficult parking during peak hours: If parking is full when you visit during dinner rush, customers will experience the same frustration.
❌ No nearby offices or residences: Restaurants need concentrated customer base within walking distance.
❌ Income mismatch: Median income should be 3-4x your average check minimum.
❌ Market oversaturation: Six pizza places for 12,000 residents when healthy ratio is one per 4,000 means fierce competition.
❌ Poor kitchen systems: Inadequate ventilation means $50,000-150,000 unexpected costs.
❌ Restrictive lease terms: Prohibitions on alcohol, operating hours, or noise can kill your concept.
❌ No evening traffic for dinner concepts: If the area is dead at 6-8 PM, dinner service won’t work.
❌ Extreme seasonal fluctuations: Beach towns thriving in summer but 60% closed in winter create cash flow nightmares.
❌ Poor visibility: Second-floor or hidden locations sacrifice discovery traffic.
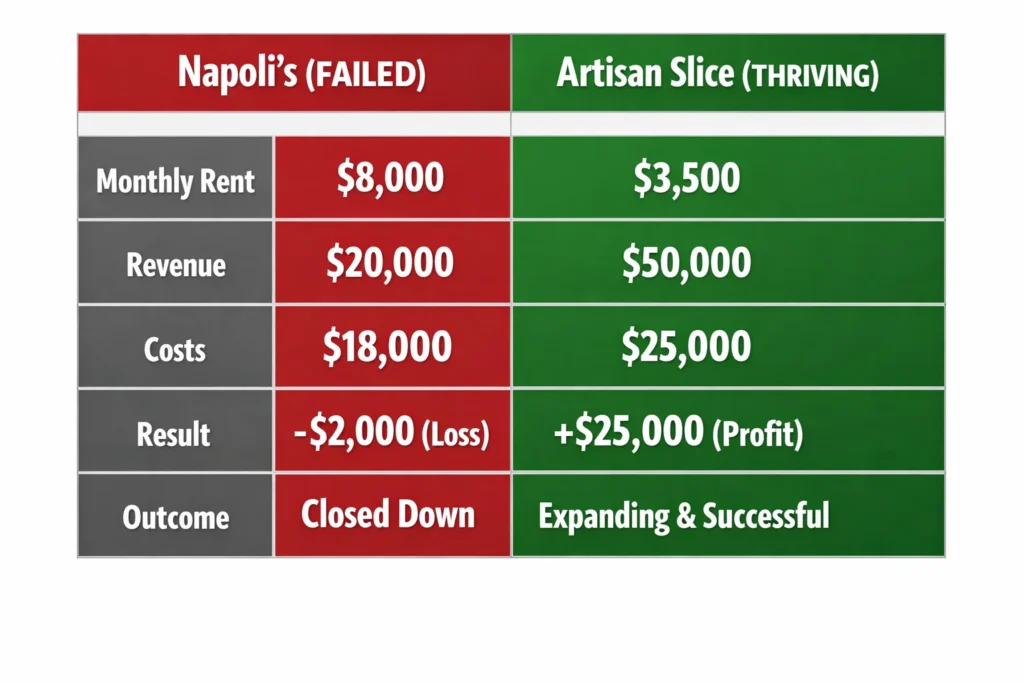
Case Study: Two Pizza Restaurants, Different Outcomes
Napoli’s Pizza: Failed in 11 Months
Location: Suburban strip mall, $3,200/month rent What looked good: Affordable rent, existing equipment, family neighborhoods nearby What went wrong: Median income $52,000 (too low for $18-24 pizzas), six pizza options already serving 18,500 residents (50% oversaturated), weekday evening traffic was sparse, shared parking often full.
Result: Average monthly revenue $18,500, costs $24,200. Lost $88,700 in 11 months.
Artisan Slice: Thriving After 24+ Months
Location: Downtown mixed-use, $5,800/month rent What the data showed: Median income $89,000, 11,700 residents + office workers, only one pizza competitor nearby, 2,400-3,000 daily pedestrians, ground-floor visibility, parking garage nearby.
Result: Year-one revenue $892,000, monthly profit $14,500, recovered entire $195,000 investment in 13 months.
Key lesson: Lisa paid $31,200 more annually in rent but generated $700,000+ more in revenue. Higher rent in the right location crushes low rent in the wrong location.
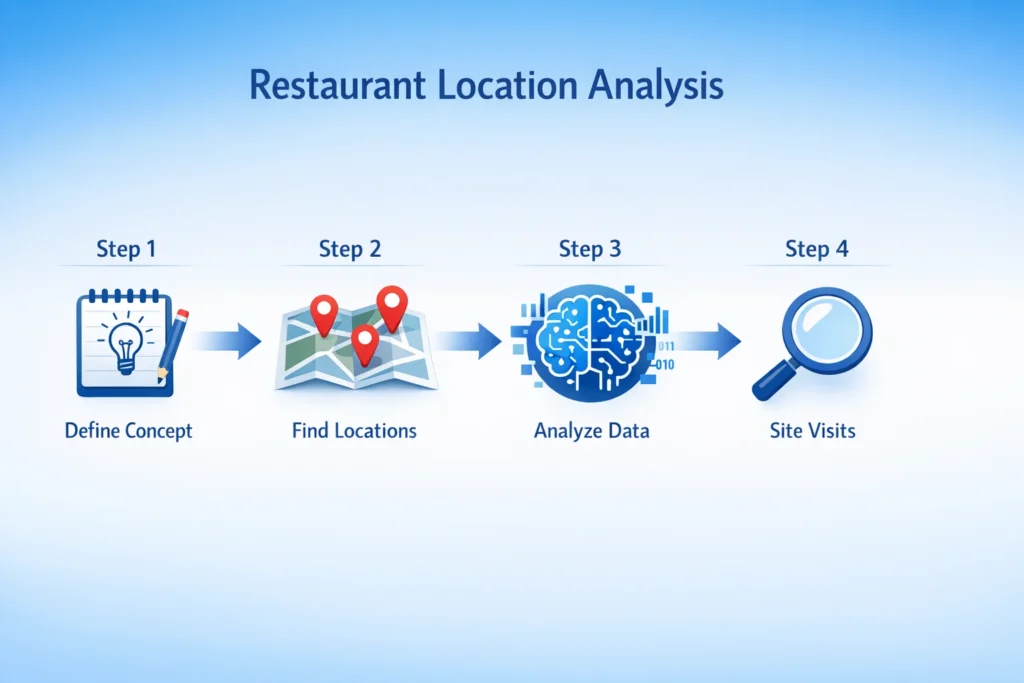
How to Analyze Restaurant Locations in 4 Steps
Step 1: Define Your Restaurant Concept First
Be specific: “Authentic Neapolitan pizza with craft cocktails, casual upscale, $18-28 entrees, dinner-focused with weekend lunch” not just “Italian restaurant.”
Answer: What’s your cuisine and service style? Who’s your target customer (age, income, lifestyle)? What’s your average check? What are your operating hours? Do you need alcohol sales?
Step 2: Identify 5+ Potential Locations
Never analyze just one location. Find 8-10 possibilities through commercial real estate sites (LoopNet, Crexi), restaurant brokers, driving target neighborhoods, and networking.
Create shortlist based on: square footage fits (1,200-3,500 for most independents), rent within budget (6-10% of projected revenue max), zoning permits restaurant use, previous food service use or convertible within budget.
Step 3: Run Comprehensive Analysis
Use AI-powered location intelligence to analyze all seven factors in 60 seconds for $5-20 per location. For 5 shortlisted locations, investing $25-100 provides demographic profiles, competition maps, foot traffic patterns, accessibility scores, market trends, revenue projections, and comparative scoring.
Eliminate locations scoring below 6/10. Focus on top 3.
Step 4: Validate with Site Visits
Visit remaining locations at multiple times: peak meal periods, slow periods, different days, different weather. Observe actual parking availability, pedestrian traffic matching your target customer, visibility from roads, neighboring business health, overall neighborhood feel.
Talk to neighboring owners about traffic, demographics, and challenges. Test the customer journey—park and walk to location. Verify data assumptions match reality.
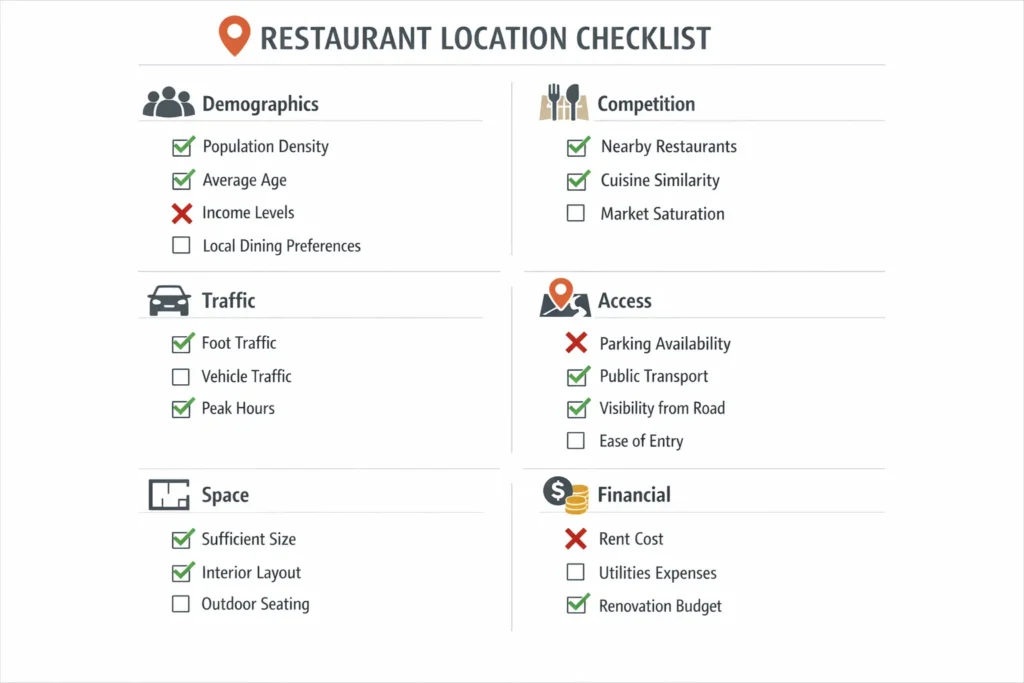
Restaurant Location Analysis Checklist
Must-Verify Before Signing Lease:
Demographics:
- [ ] Median income 3-4x your average check
- [ ] Age distribution matches target
- [ ] Sufficient population density (5,000-15,000 within 1 mile for casual dining)
Competition:
- [ ] Market not oversaturated (1 restaurant per 300-500 residents)
- [ ] Clear differentiation from competitors
- [ ] Competitors appear healthy (good ratings, busy)
Traffic & Access:
- [ ] Foot traffic matches operating hours
- [ ] Adequate parking (15-20 spaces for 3,000 sq ft casual)
- [ ] Good visibility from main roads
- [ ] Easy delivery access
Space:
- [ ] Kitchen 40-50% of total space
- [ ] Commercial ventilation present
- [ ] 200+ amp electrical service
- [ ] Previous restaurant use (saves $75K-200K)
Financial:
- [ ] Total occupancy cost (rent + CAM + fees) calculated
- [ ] Revenue projection exceeds break-even by 25%+
- [ ] Lease terms reviewed by attorney
- [ ] No deal-breaking restrictions
Red Flags:
- [ ] No previous restaurant failures in space
- [ ] Parking available at your peak hours
- [ ] Demographics match pricing
- [ ] Evening traffic verified (for dinner concepts)
Only proceed if 85%+ boxes check YES.
Frequently Asked Questions
How much should I spend on restaurant location analysis?
$15-50 for AI-powered analysis of 3-5 locations. A wrong location costs $100,000-500,000+. This is your highest-ROI investment.
What’s ideal population density for a restaurant?
Quick-service needs 2,000-5,000 within half-mile. Casual dining needs 5,000-15,000 within one mile. Fine dining needs 10,000+ affluent residents within 3 miles. Count residents + office workers.
How many competitors is too many?
Healthy ratio: one restaurant per 300-500 residents. Competition becomes problematic when saturation significantly exceeds this, multiple competitors offer identical concepts without differentiation, or most show signs of struggle.
Should I choose high-traffic expensive rent or low-rent less traffic?
Almost always choose higher traffic despite higher rent. Revenue drives profitability. A location generating $80,000 monthly with $7,000 rent is far more profitable than $25,000 monthly with $3,500 rent.
Can I succeed where a previous restaurant failed?
Sometimes yes if failure was poor execution. Often no if 2-3+ restaurants failed—that signals structural location problems. Analyze thoroughly to understand why previous tenants failed before committing.
How important is prior restaurant use?
Extremely important. Saves $75,000-200,000 in buildout and 2-4 months construction. Spaces with restaurant systems already have ventilation, grease traps, proper plumbing/electrical/gas, and code-compliant surfaces.
Choose Your Restaurant Location with Confidence
Restaurant location is the highest-impact decision you’ll make. It affects customer base, revenue potential, costs, competitive positioning, and ultimately whether you build a thriving business or suffer devastating failure.
The good news: location analysis is completely accessible. AI-powered location intelligence analyzes demographics, competition, foot traffic, accessibility, and revenue potential in 60 seconds for $5-20 per location.
Your next steps:
- Define your concept clearly
- Identify 5+ potential locations
- Run comprehensive analysis on each
- Validate top choices with site visits
- Make data-driven decisions
Don’t let your restaurant become another preventable failure statistic. The difference between success and failure is often choosing the right location using data instead of guesswork.
Analyze your restaurant location in 60 seconds at Spotfic.com and make the smartest investment of your restaurant journey.